Echoes in the Code: How Virtual Sports Engine Data Streams Inform Live Odds Recalibrations for Hockey, Basketball, and Beyond
Iris Hoffmann · Aug 13, 2026
Echoes in the Code: How Virtual Sports Engine Data Streams Inform Live Odds Recalibrations for Hockey, Basketball, and Beyond
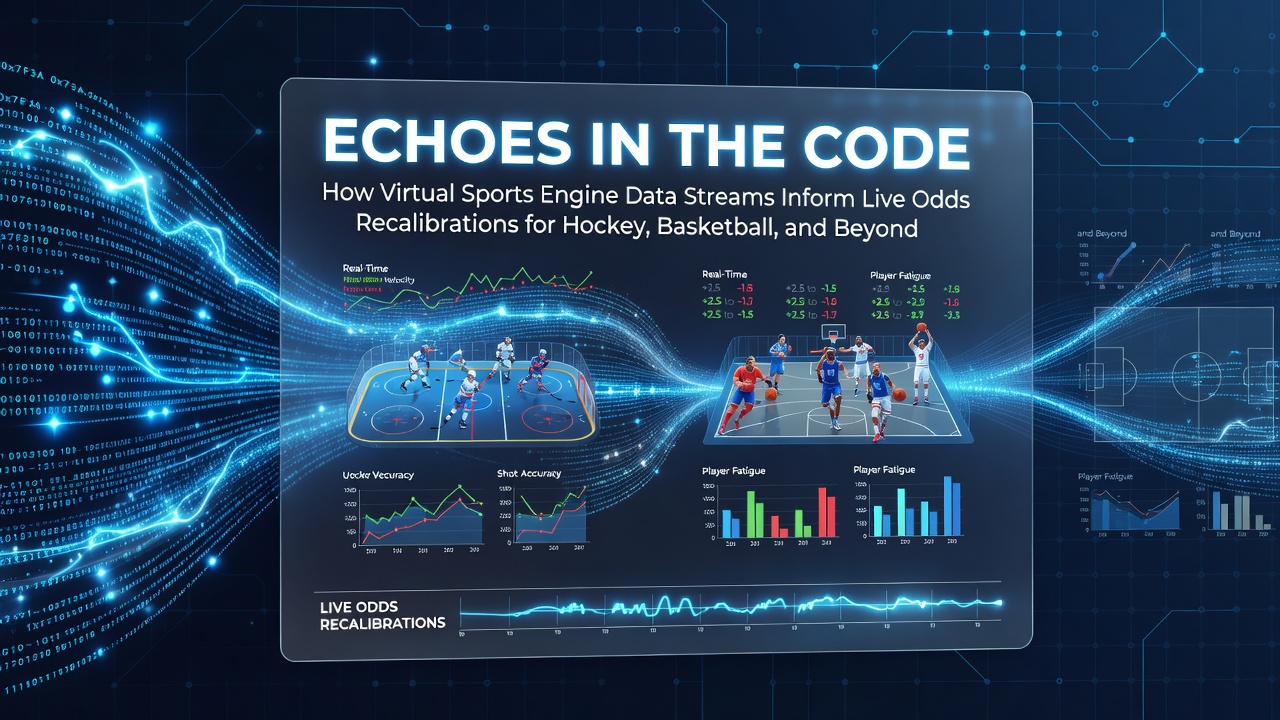
Virtual sports engines generate continuous streams of performance metrics from simulated matches in titles such as NHL and NBA 2K, and these outputs reach betting platforms that adjust live odds in real time. Developers release updated physics models each season, and operators integrate those refinements into proprietary algorithms that process thousands of variables per second. By August 2026 analysts tracked how engine-derived shot accuracy rates and fatigue indicators altered line movements across major hockey and basketball markets.
Engine Outputs and Data Pipelines
Simulation software records player positioning, velocity vectors, and collision outcomes at sub-second intervals, after which teams export aggregated datasets to third-party analytics providers. Those providers normalize the figures against historical real-world statistics before transmitting calibrated probabilities to sportsbook servers. Observers note that hockey engines emphasize puck trajectory and board rebounds, while basketball versions prioritize court spacing and shot arc data, yet both feed similar recalibration routines once the information leaves the console environment.
Application in Live Hockey Markets
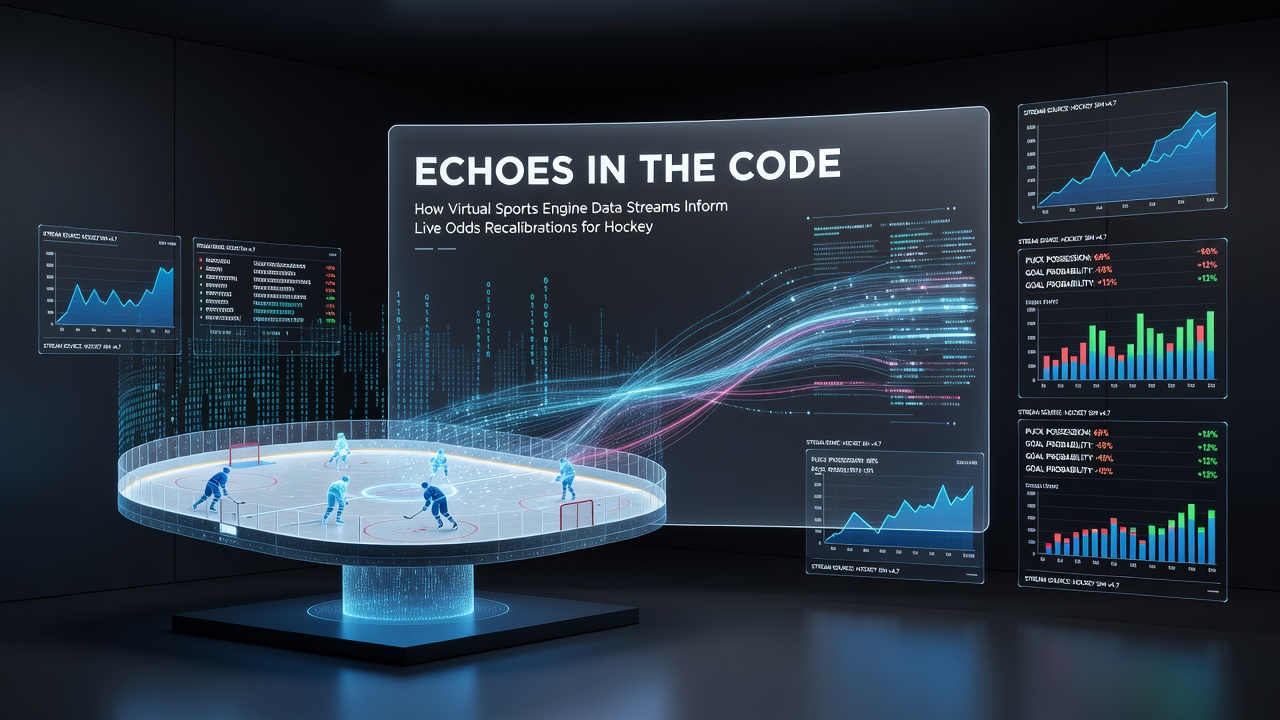
During NHL seasons operators monitor virtual shift-length distributions to anticipate real-player stamina thresholds, and when simulated lines show elevated turnover rates after extended ice time the corresponding live under/over totals shift within seconds. Research from Canadian gaming authorities indicates that such cross-referenced streams reduced variance in certain period totals by measurable margins between 2023 and 2025. One case involved a platform that adjusted goal-scoring probabilities after virtual power-play simulations repeatedly produced higher-than-average shot volumes from the left circle, prompting immediate odds tightening on related prop bets.
Basketball Simulation Metrics in Action
Basketball engines track release angles and defensive closeout distances, and betting models convert those values into expected points-per-possession estimates that update continuously during live games. When virtual three-point distributions diverge from established league averages the algorithms widen or narrow spreads accordingly. Figures released by the Nevada Gaming Control Board show increased usage of these streams in college basketball wagering models starting in late 2024, with documented adjustments occurring most frequently in the final eight minutes of halves. Analysts observe that engine-generated rebound rates also influence live totals because simulated second-chance opportunities correlate with actual possession-length statistics.
Expansion to Additional Sports and Leagues
Operators now extend the same methodology to soccer and baseball simulations, where engine data on set-piece execution and pitch location refine in-game totals and run-line probabilities. European regulatory reports note parallel adoption patterns in markets that permit live wagering, and academic papers from Australian universities document how multi-sport data fusion improves short-term forecast accuracy when models incorporate both hockey and basketball outputs. The practice remains consistent: raw engine logs enter processing pipelines, normalized values enter risk engines, and revised odds reach customer interfaces without manual intervention.
Technical Integration Challenges
Latency between simulation completion and odds publication must stay under 500 milliseconds, which requires dedicated data channels and edge-computing nodes located near major exchange servers. Compatibility issues arise when game publishers alter physics parameters mid-season, forcing recalibration of downstream models. Industry organizations such as the European Gaming and Betting Association have published technical guidelines addressing version control and data provenance, and those documents emphasize audit trails that link each odds movement back to specific engine releases.
Conclusion
Virtual engine data streams supply structured performance indicators that operators translate into live odds adjustments across hockey, basketball, and expanding sports categories. The process relies on continuous normalization against real-world benchmarks, rapid transmission protocols, and regulatory oversight that varies by jurisdiction. As simulation fidelity increases through 2026 and beyond, the volume of usable metrics continues to grow while the core mechanism of feeding engine outputs into recalibration algorithms remains unchanged.